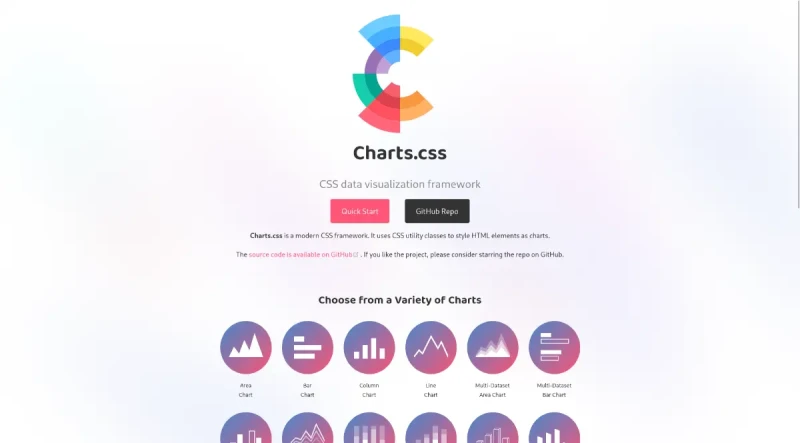

Charts.css is a modern CSS framework. It uses CSS utility classes to style HTML elements as charts.
Charts.css is a CSS framework that uses CSS utility classes to style HTML elements as charts. It offers a variety of chart types and is designed to be customizable, responsive, and accessible.
Here are its main features and functionalities:
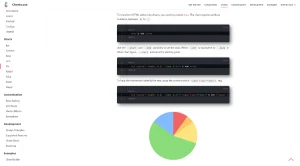
Variety of Charts: It includes a wide array of chart types such as area, bar, column, line, pie, radial, polar, radar, and mixed charts, as well as multi-dataset versions of some charts. It also offers stacked columns and 3D effects.
Semantic Structure: Uses HTML tags to display data.
Customizable: Allows for custom styling using CSS.
Responsive: Charts scale using media queries.
Accessible: Raw data is included within the markup.
No Dependencies: It has zero external overhead and does not require any JavaScript, which improves performance.
Small Library: The file size is small, with a 76kb file size (7kb gzipped).
Open Source: The code is open source and available on GitHub under the MIT license.
Framework Benefits:
Better Performance: No JavaScript means no rendering, which improves performance.
Large Variety: Supports many chart types.
Easy to Use: It uses CSS utility classes to style HTML elements.
People Behind the Project: Developed by Rami Yushuvaev (developer) and Lana Gordiievska (designer).
You may also be interested in ...

MuCSS
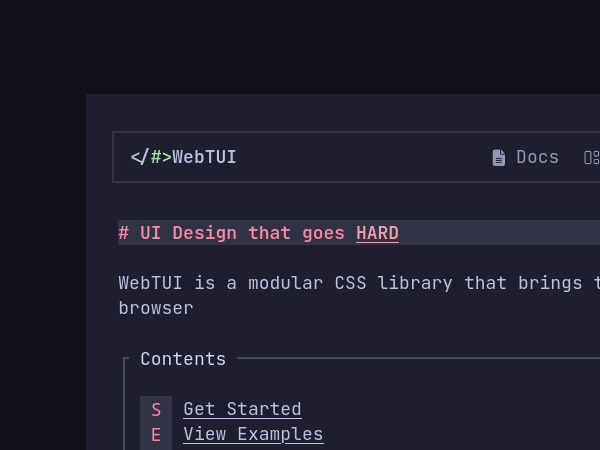
Webtui
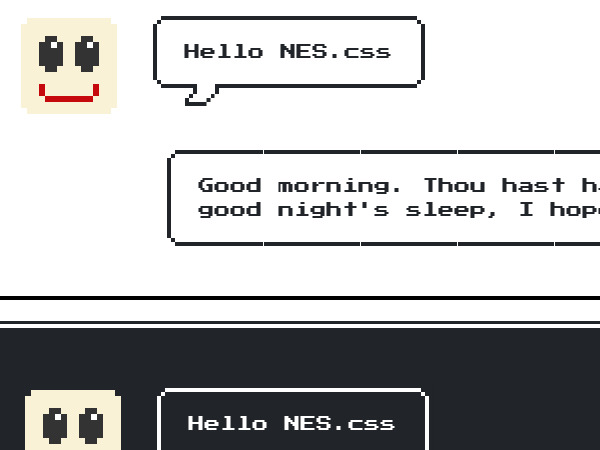
NES.css